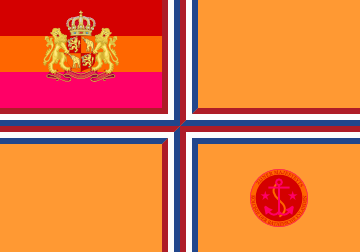
The His Majesty's Colony of The Batavian Islands
Eendracht maeckt Macht maeckt Vrijheyt
Region: Democratic Socialist Assembly
Quicksearch Query: The Batavian Islands
|
Quicksearch: | |
NS Economy Mobile Home |
Regions Search |
The Batavian Islands NS Page |
|
| GDP Leaders | Export Leaders | Interesting Places BIG Populations | Most Worked | | Militaristic States | Police States | |

Eendracht maeckt Macht maeckt Vrijheyt
Region: Democratic Socialist Assembly
Quicksearch Query: The Batavian Islands
| The Batavian Islands Domestic Statistics | |||
|---|---|---|---|
| Government Category: | His Majesty's Colony | ||
| Government Priority: | Defence | ||
| Economic Rating: | Thriving | ||
| Civil Rights Rating: | Good | ||
| Political Freedoms: | Average | ||
| Income Tax Rate: | 19% | ||
| Consumer Confidence Rate: | 103% | ||
| Worker Enthusiasm Rate: | 105% | ||
| Major Industry: | Woodchip Exports | ||
| National Animal: | elephant | ||
| The Batavian Islands Demographics | |||
| Total Population: | 20,733,000,000 | ||
| Criminals: | 2,069,738,092 | ||
| Elderly, Disabled, & Retirees: | 2,707,345,655 | ||
| Military & Reserves: ? | 939,091,496 | ||
| Students and Youth: | 3,652,117,950 | ||
| Unemployed but Able: | 3,097,018,926 | ||
| Working Class: | 8,267,687,880 | ||
| The Batavian Islands Government Budget Details | |||
| Government Budget: | $137,547,141,247,370.55 | ||
| Government Expenditures: | $132,045,255,597,475.72 | ||
| Goverment Waste: | $5,501,885,649,894.83 | ||
| Goverment Efficiency: | 96% | ||
| The Batavian Islands Government Spending Breakdown: | |||
| Administration: | $3,961,357,667,924.27 | 3% | |
| Social Welfare: | $15,845,430,671,697.09 | 12% | |
| Healthcare: | $15,845,430,671,697.09 | 12% | |
| Education: | $22,447,693,451,570.88 | 17% | |
| Religion & Spirituality: | $1,320,452,555,974.76 | 1% | |
| Defense: | $22,447,693,451,570.88 | 17% | |
| Law & Order: | $21,127,240,895,596.12 | 16% | |
| Commerce: | $14,524,978,115,722.33 | 11% | |
| Public Transport: | $1,320,452,555,974.76 | 1% | |
| The Environment: | $0.00 | 0% | |
| Social Equality: | $7,922,715,335,848.54 | 6% | |
| The Batavian IslandsWhite Market Economic Statistics ? | |||
| Gross Domestic Product: | $111,790,000,000,000.00 | ||
| GDP Per Capita: | $5,391.89 | ||
| Average Salary Per Employee: | $9,505.15 | ||
| Unemployment Rate: | 20.70% | ||
| Consumption: | $363,525,138,378,915.88 | ||
| Exports: | $56,942,230,765,568.00 | ||
| Imports: | $60,143,043,608,576.00 | ||
| Trade Net: | -3,200,812,843,008.00 | ||
| The Batavian Islands Non Market Statistics ? Evasion, Black Market, Barter & Crime | |||
| Black & Grey Markets Combined: | $134,666,217,517,194.31 | ||
| Avg Annual Criminal's Income / Savings: ? | $5,589.72 | ||
| Recovered Product + Fines & Fees: | $16,159,946,102,063.32 | ||
| Black Market & Non Monetary Trade: | |||
| Guns & Weapons: | $5,826,064,568,446.38 | ||
| Drugs and Pharmaceuticals: | $7,092,600,344,195.59 | ||
| Extortion & Blackmail: | $4,728,400,229,463.73 | ||
| Counterfeit Goods: | $11,989,872,010,425.88 | ||
| Trafficking & Intl Sales: | $506,614,310,299.69 | ||
| Theft & Disappearance: | $6,079,371,723,596.22 | ||
| Counterfeit Currency & Instruments : | $9,287,929,022,160.89 | ||
| Illegal Mining, Logging, and Hunting : | $168,871,436,766.56 | ||
| Basic Necessitites : | $7,936,957,528,028.40 | ||
| School Loan Fraud : | $5,741,628,850,063.10 | ||
| Tax Evasion + Barter Trade : | $57,906,473,532,393.55 | ||
| The Batavian Islands Total Market Statistics ? | |||
| National Currency: | guilder | ||
| Exchange Rates: | 1 guilder = $0.52 | ||
| $1 = 1.94 guilders | |||
| Regional Exchange Rates | |||
| Gross Domestic Product: | $111,790,000,000,000.00 - 45% | ||
| Black & Grey Markets Combined: | $134,666,217,517,194.31 - 55% | ||
| Real Total Economy: | $246,456,217,517,194.31 | ||
| Democratic Socialist Assembly Economic Statistics & Links | |||
| Gross Regional Product: | $33,321,204,538,408,960 | ||
| Region Wide Imports: | $4,227,715,355,901,952 | ||
| Largest Regional GDP: | Opalaland | ||
| Largest Regional Importer: | Opalaland | ||
| Regional Search Functions: | All Democratic Socialist Assembly Nations. | ||
| Regional Nations by GDP | Regional Trading Leaders | |||
| Regional Exchange Rates | WA Members | |||
| Returns to standard Version: | FAQ | About | About | 484,537,906 uses since September 1, 2011. | |
Version 3.69 HTML4. V 0.7 is HTML1. |
Like our Calculator? Tell your friends for us... |